DUG is a snapshot data graphing utility designed to be as simple as possible whilst still being as powerful as required. By "snapshot data", I mean data that DUG can query an external source for on a timed basis to build up snapshots of the data throughout the course of time. DUG is written in C++ and works nicely under WIN32, WIN64 (32bit binaries -- 64bit binaries have not been tested, but should work fine), Linux (32bit and 64bit).
DUG had a much cooler name but unfortunately there's a dormant project with that name. I would really like it if the SourceForge team would have systems in place to remove dead and long-standing dormant projects. There are many empty projects on SourceForge which have been registered and have little or no activity for years. Like IP addresses, the good names are running out. DUG was renamed out of frustration waiting for the project name that I wanted to become available. The short of it is this: I'm Daf, I wrote DUG, it's meant to be easy / simple to use (uncomplicated) and it draws graphs. Exciting stuff.
DUG currently supports SNMP and XML data sources. DUG has only been fully tested with SNMP version 2c. Other versions may or may not work. Version 2c is the most common version to be found "in the wild".
DUG can be used to graph information like:
DUG can be used instead of MRTG or CACTII (which is built on MRTG). DUG was originally designed to provide similar functionality to that of MRTG with an easier-to-configure interface. DUG expanded beyond that original scope to include XML sources. DUG, by default, has some nice features not present (or difficult to reproduce) with MRTG:
Pictures often speak louder than words. Here are two graph sections from
my home report:
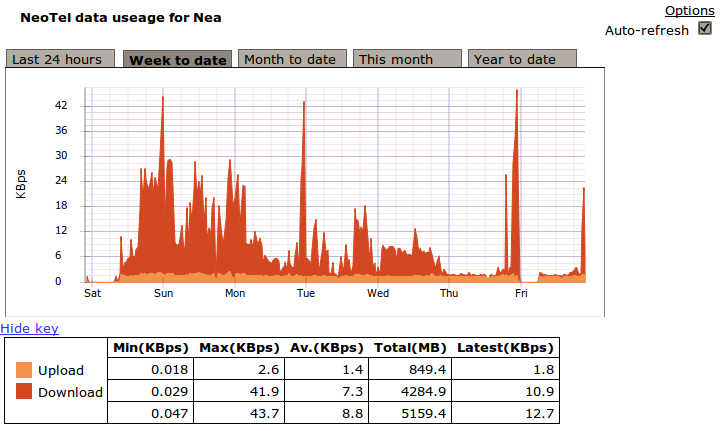
This shows the bandwidth usage on my home machine. The darker orange is download and the lighter orange is upload. Note that I have quite a constant upload because I throttle my outgoing torrents due to my terrible upload speed -- hence the fairly constant 1kB/s. The graph here is also rendered in stacked mode such that the overall shape of the graph shows the total bandwidth usage (in and out) whilst the individual directions' usage can be inferred from looking at the graph. Note that DUG chose the colors for this graph -- I just left them unconfigured and DUG chose random colors, adding them to the config file
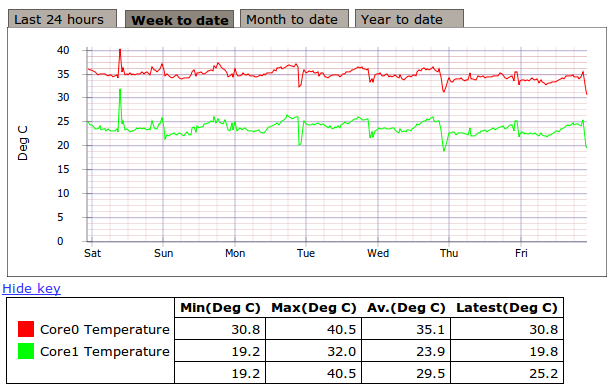
This shows my CPU temperature history on my home machine. I get my CPU temperatures via SNMP.
Note that all of the page except the dataset have taken on my system colors. DUG tries to "fit in" with the user's preferences. That being said, DUG is fully open for a web developer to alter without delving into the source code of DUG itself. DUG will honor a stylesheet with the name "style.css" in the same dir as the report. DUG can also inline an arbitrary CSS file mentioned by path in the report's INI file, or can use per-report css files that are found in the report's output dir, providing the name of the css file is the same as that of the report (eg "foo.css" for report "foo.html").
DUG can also take extra javascript, via similar mechanisms ("foo.js" for report "foo.html") and a dir-wide "dug.js" in the report dir. Once again, this is to assist eager web developers who don't want to meddle with the DUG C++ source.
There's an interactive demo of DUG output here. Bear in mind that DUG generates static output, so the data will quickly become dated. The interactivity is in the page itself -- you can't regenerate the report. Also, I've included a graph which is very young to demonstrate an XML source. The HDD temp graph gets its data from output from this python script which basically just uses the commandline hddtemp tool to build a very simple XML document like this. The INI file used to create this report is here.
The short answer is: anyone who wants to see trends in data which is available via SNMP or XML. This means:
DUG tries to almost be a good UNIX tool -- it does two things, and does them fairly well:
DUG relies on the person setting it up to schedule DUG to be run as required. You would schedule DUG via cron or Task Scheduler to capture and draw as required. This way, data granularity and system resource usage is controlled by you -- not DUG. Capture more often, and your data will be finer, but your database will be larger. Graph generation will take a little longer. Capture less often, and your database is smaller and graph generation is faster but graphs will be "coarser".
Some examples of usage intervals and expected experiences are as follows:
DUG produces STATIC html and svg (optional conversion to png) output: DUG does not need a web server to be useful. Obviously, if you want to make the output from DUG available over the web, you need a web server. But home users can just point their browsers at the html output from DUG.
DUG was originally a project for work, where I am required to document my work on a MediaWiki site. SourceForge also supplies MediaWiki, so, for your own ease of use, the readme.wiki is also available in formatted form here. The document at this location may also be more up-to-date than its counterpart(s) in packages. If I fix an error, it is most likely at the SF wiki page. My apologies for any discrepencies between the README you have and the one presented here.
DUG is hosted on SourceForge, and can be obtained here. DUG currently does not have a graphical configuration helper -- but one is planned. DUG does not have an official installer either -- simply unzip the contents of the WIN32 release wherever you want it, or build from source.